Sanny
Garin
Jr
Data Analyst

Hi, I'm Sanny Garin Jr, a technician turned Data Analyst. Welcome to my page! I am thrilled to bring my new found skills and dedication to the field of Data Analytics!
Download CVReady to Make an Impact
I am an aspiring data analyst. I am currently enrolled in Refocus, the top data analytics bootcamp in the Philippines, where I have gained a solid foundation in tools such as Excel, SQL, Power BI, and Python. I worked on a variety of projects that required me to analyze large amounts of data and I developed a keen eye for details and an analytical mindset that enables me to identify patterns and trends in complex dataset. Check out my portfolio below.
LinkedIn ProfileData Analysis and Visualization
Portfolio
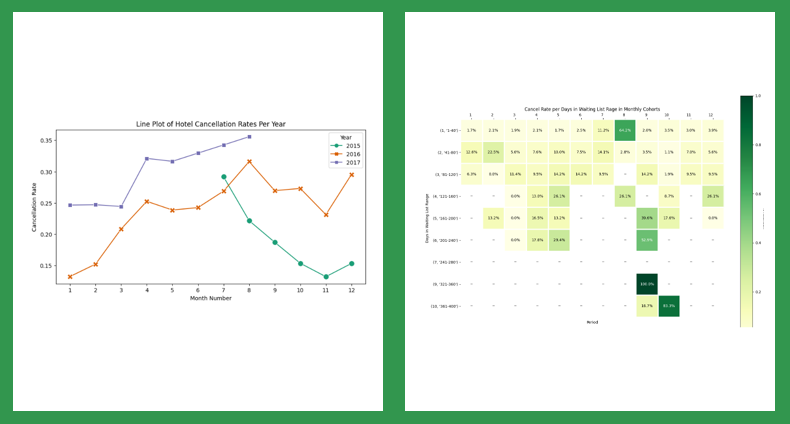
Hotel Business Analysis
As a Data Analyst of a company owning a city hotel in a metropolitan area and a resort hotel located near a coastline both within the United States, I’ve been assigned by your manager to provide insights on the recent rise of hotel booking cancellations in both hotels for the past few months. These events causes the management to suffer financial losses and they would like to know some leads on reasons why customers cancel their room reservations.
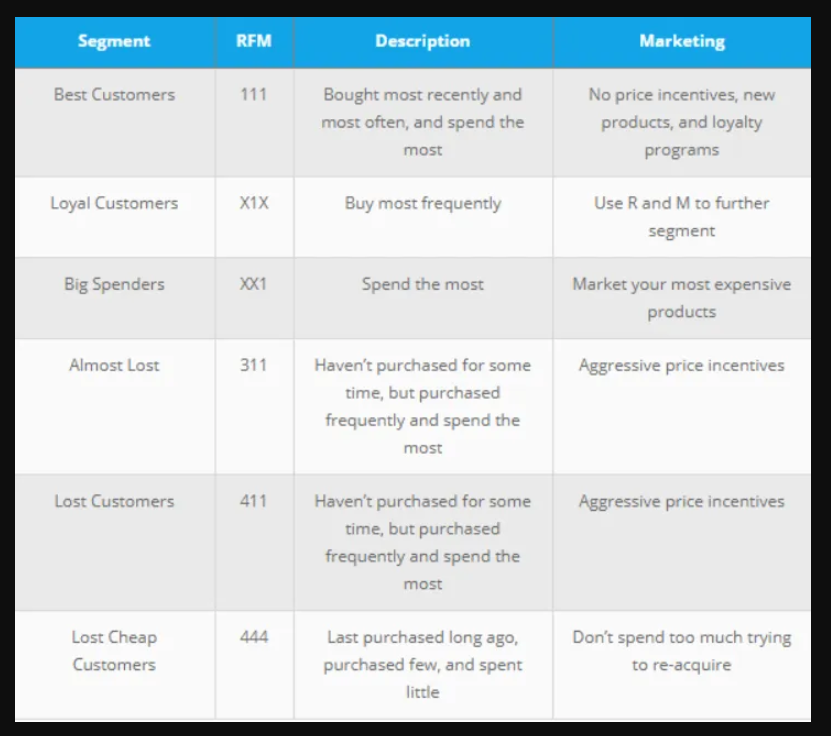
RFM Analysis
The dataset under study contains credit card transactions from the State of Oklahoma. It includes information on purchases made through the purchase card programs administered by the state and higher educational institutions. The purchase card information is updated monthly after the end of every month. As such, July information is added in August, August in September, and so on and so forth. The goal is to provide some key insights and recommendations to encourage customers to spend more with the credit cards.
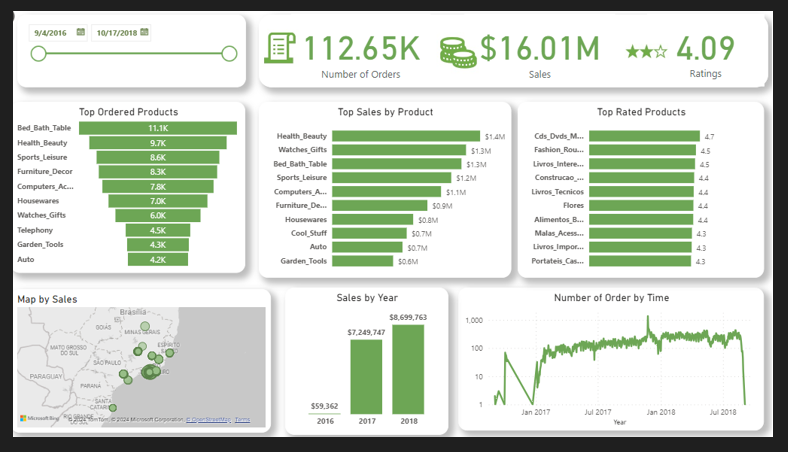
Operation Performance Analysis
The dataset for this study is from a Brazilian e-commerce company called Olist Store. It contains information on 100,000 orders made from 2016 to 2018 from various marketplaces in Brazil. The dataset includes details such as the status of the order, the price and payment information, customer location, and product attributes.
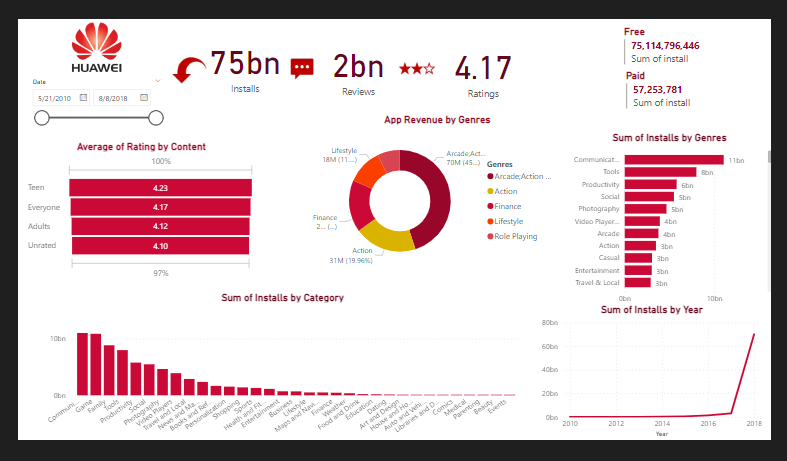
Amazon Transaction Analysis
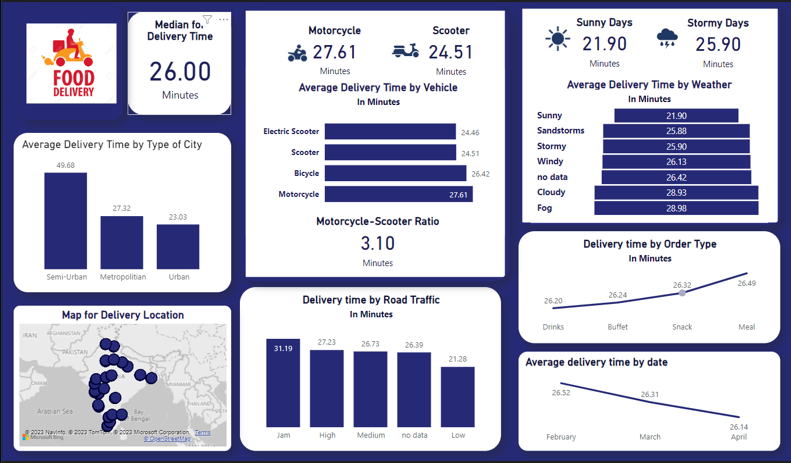
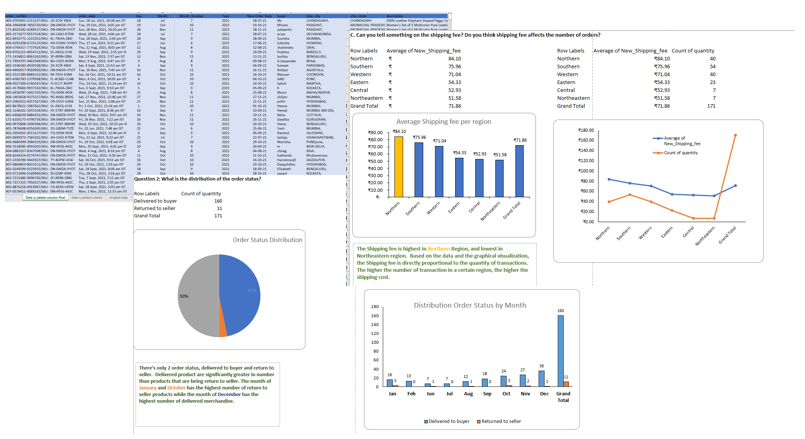
Amazon India is trying to analyze their transaction data regarding delivery information. As an analyst, I will help them explore the data extracted from the system by creating a report with data storytelling. This report will be shared with senior management, so the information should be clear and accurate.
Table Formatting | Sorting | Filtering | Basic and Common Functions | Pivot tables | Data Visualization | Logic, Text, Search Functions | Data Preprocessing | Data Storytelling
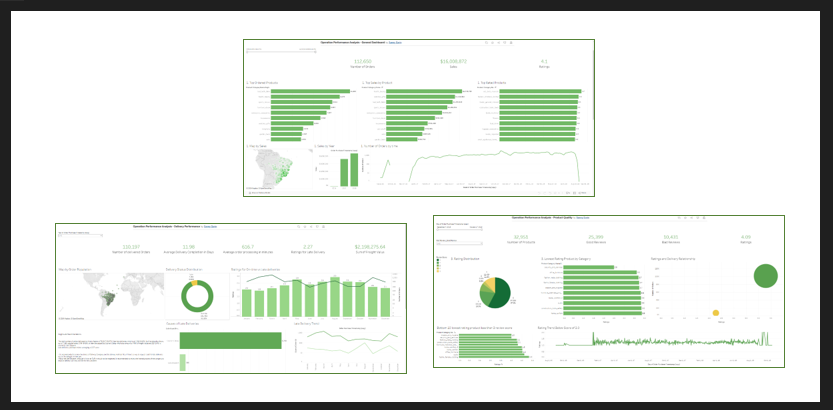
Operation Performance Analysis Tableau Version
The dataset for this study is from a Brazilian e-commerce company called Olist Store. It contains information on 100,000 orders made from 2016 to 2018 from various marketplaces in Brazil. The dataset includes details such as the status of the order, the price and payment information, customer location, and product attributes.
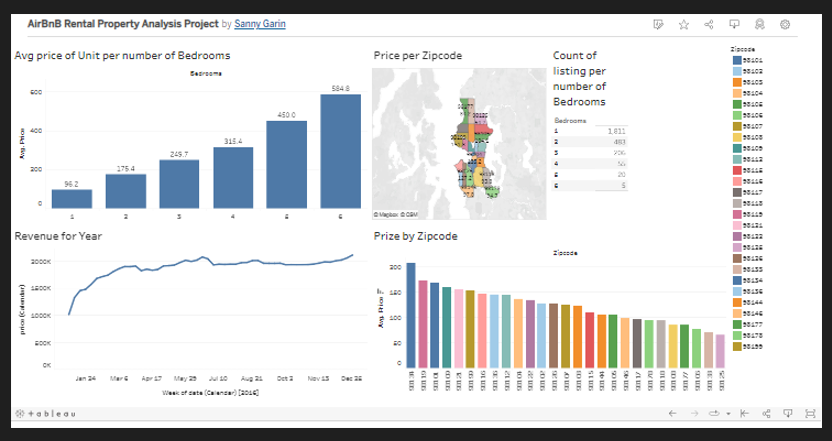
AirBnB Rental Property Analysis Project
This Project is a Biginner project to familiarize myself in using Tableau. The data set is from insideairbnb.com and this project aims to answer few questions: What location can one make the most profit from with AirBnB business?, What is the best time to rent out your property? How much people are charging per number of bedrooms?
Importing Data in Tableau | Joining tables in Tableau | Sorting | Filtering | Data Visualization in Tableau
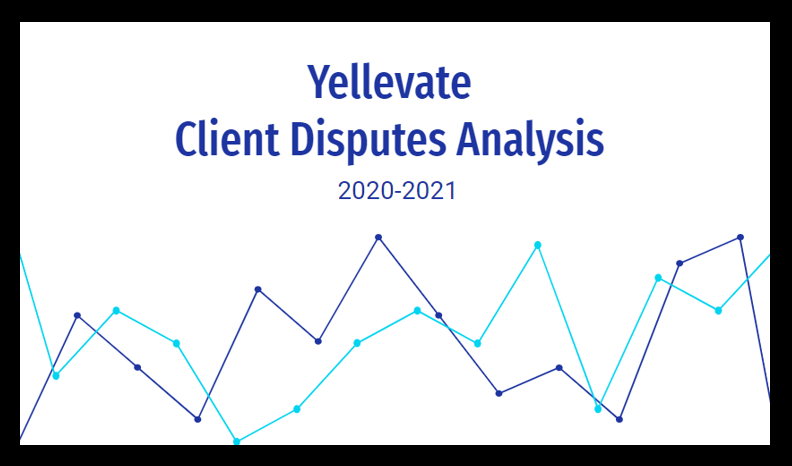
Client Disputes Analysis
This is a Refocus Online Academy Project that involves team effort to evaluate a client’s dissatisfaction with company services using tools such as SQL and Excel. By the end of the case study, the group provided a comprehensive visual report, along with recommended actions for resolution.
Fund Source Analysis
You are a data analyst working for a company that is planning to venture into a new market involving financial services. Insights from your report will be utilized by decision makers for their alternatives analysis as they explore probable sources of financing to start offering the new service.
Output
Platforms
These are the websites where you may view all of my work. I use Github to host all of my repositories. Medium is where I document and share the process of my projects.
Recent Articles
Achievements
-
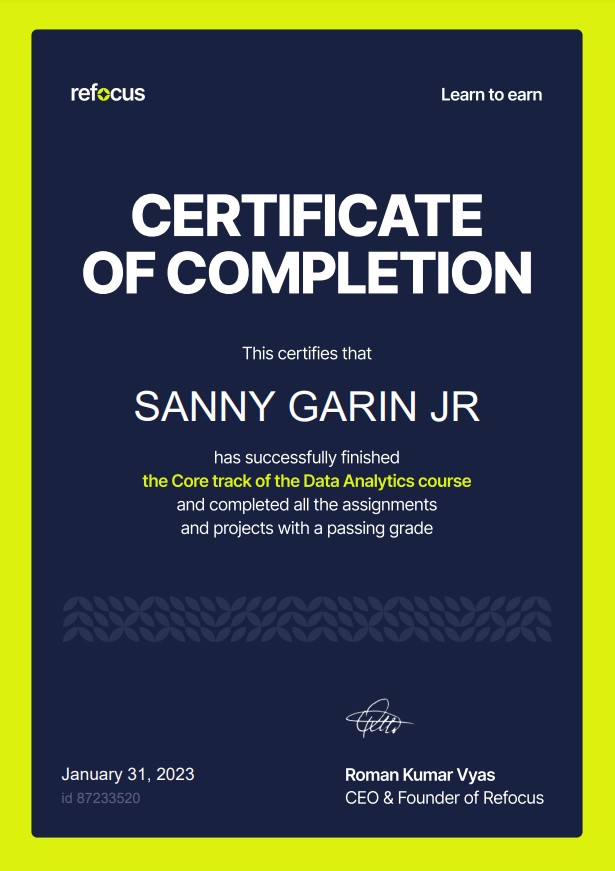
Refocus Data Analytics Core Track Certificate
I have completed the core track of the Data Analytics program of Refocus. The core track comprises of Microsoft Excel, PostgreSQL, and Power BI. I have completed 50 hours of video lectures, assessments, and self-study. With 14 assignments passed a lot of skills acquired. During the core track, I have also finished the Group Project: Elevating Yellavate.
View certficate -
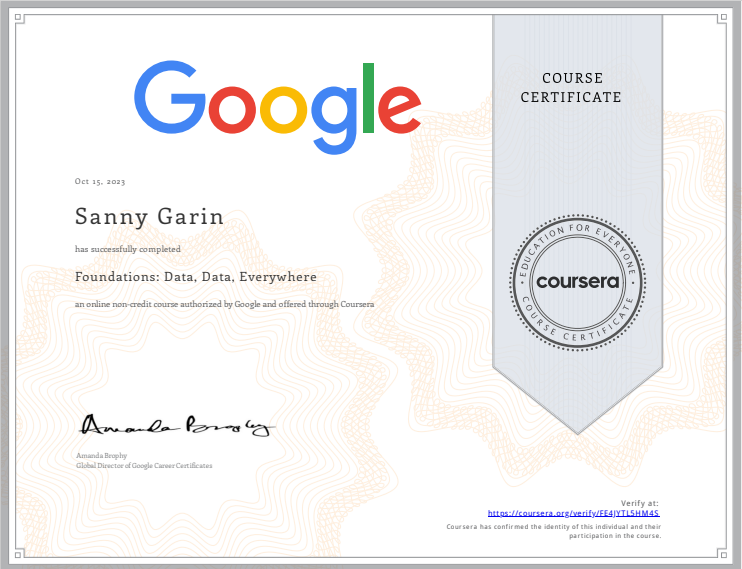
Google Data Analytics, Foundations: Data, Data, Everywhere
I completed the fundamentals on Google Data Analytics course. This course includes learning Google Spreadsheet, SQL, and introduction on data visualization tool like Tableau and Power BI
View certficate -
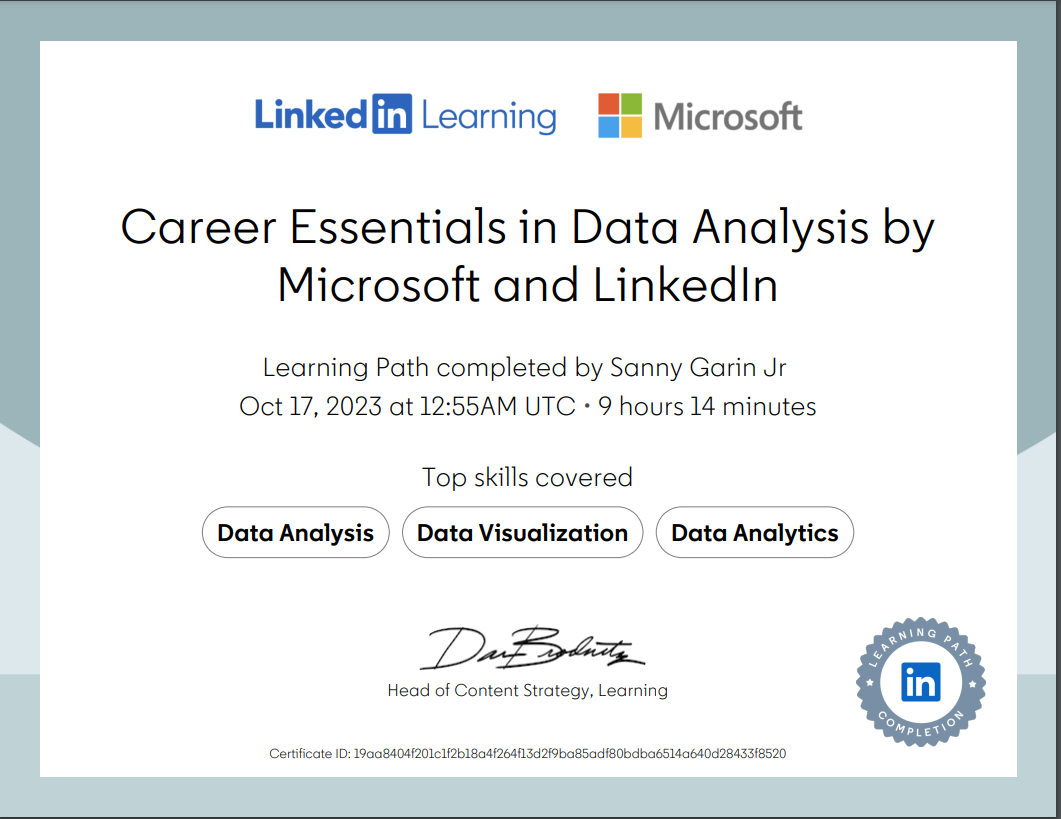
Career Essentials in Data Analysis by Microsoft and LinkedIn
This course comprises foundational concepts used in data analysis and practice using software tools for data analytics and data visualization.
View certficate -
LinkedIn Learning Become a Data Analyst
This course includes familiarization for variety of Data Analytics Tool such as Excel, Power BI, Tableau, R-Programing with R Studio, and Python.
View certficate -
Refocus Data Analytics Graduation Certificate
I have completed the Refocus Data Analytics program. This Advance track comprises of Microsoft Excel, PostgreSQL, Power BI, Python, Business Metrics and Application of all learned skills by presenting a comprehensive Data Analysis in a Final Project.
View certficate -
Business Analytics for Data Analyst Certificate: Schneider Electric
Being an employee of Schneider Electric is a great experience, and one of the great things you can gain from this experience is learning. This training curriculum contains online training courses on Business Analytics topics dedicated for data analyst. It is organized around eight sections: BI and Analytics, Statistics, Data Visualization, selected coding languages like SQL, Rstudio, Visualization with R, and Data Science with R, tools for Exploratory Data Analysis, core concepts of Data Science, Machine Learning and Modeling, and Big Data and Internet of Thing (IoT).
View certficate -
Accenture Data Analytics and Visualization Virtual Experience
I am glad to have finished Accenture's Data Analytics and Visualization Virtual Experience via Forage. This program provided me with an excellent opportunity to learn from industry experts while also gaining hands-on experience with real-world data analytics projects. Through Forage, a portal that offers a variety of virtual experiences in a number of fields, the application program was made available without fee. I was drawn to this program by the chance to learn from Accenture, a leading global professional services company, as well as the ease of completing the program online.
View certficate